There is much talk in Vancouver these days about how the “housing bubble” may have burst, that the astonishing rise of house prices over the last couple of years is coming to an end and that, perhaps, prices may actually fall. Given this background, I was interested to have access this week to a few pages of the City of Vancouver property tax assessment register for the years 1933 to 1939.
The pages cover Block 67 in Grandview; a residential block enclosed by Clark Drive, Graveley Street, McLean Drive, and First Avenue and consisting of 24 separate lots. Nine of these lots were occupied by dwellings during the period 1933-1939, while fifteen were vacant. The period covers the depths of the Depression before eastside Vancouver’s housing market improved with the influx of wartime workers from 1940.
Using 1933 as the baseline (100%) value for the assessment, the following two charts show the fall in assessed values through 1939.
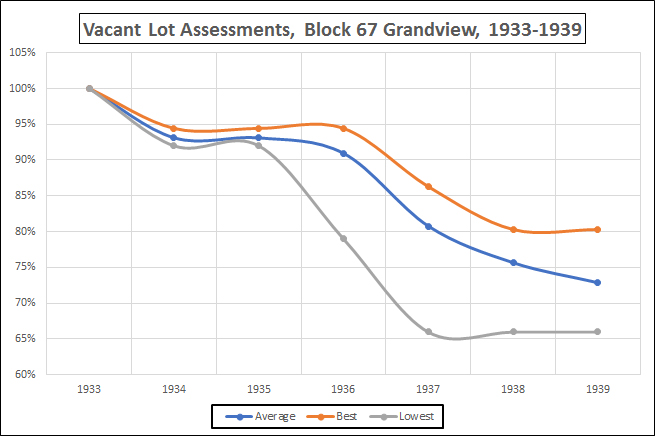
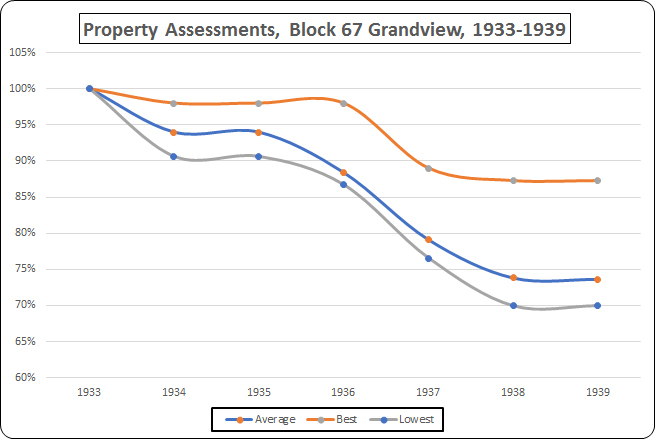
In 1933, the vacant lot assessments ranged from a low of $500 to a high of $630. The property assessments in the same year ranged from $1,280 to $3,500.
As a further indication of how housing markets can fall from dizzying heights, lots 15 and 16 in this Block which were together assessed at $1,155 in 1933 and $795 in 1939 had been offered for sale during the crazy boom year of 1910 at $7,250.

With a quarter million views, the Vancouver Real East Rollercoaster video at https://www.youtube.com/watch?v=hqOn5XEm86A tells the real story of the 1975-2010 Vancouver market, both ups and downs. Earlier in Vancouver history, as shown above, there were even wilder market corrections, but none worse than in the second decade of the 20th century. Watch the 3-minute video at https://www.youtube.com/watch?v=hqOn5XEm86A all the way to the end to see a critical public policy and personal finance message. And consider that even a 20% correction to the Vancouver residential market will suck at least $60 billion dollars out of the local economy.
LikeLike