I was recently asked about the growth of the number of restaurants on the Drive and I happen to have a graph I made in 2010 that shows that growth.
The graph below shows the number of eating places on the Drive between Venables and the Cut annually from 1935 to 1956. In addition, the last two columns show the number in 1982 and 2010.
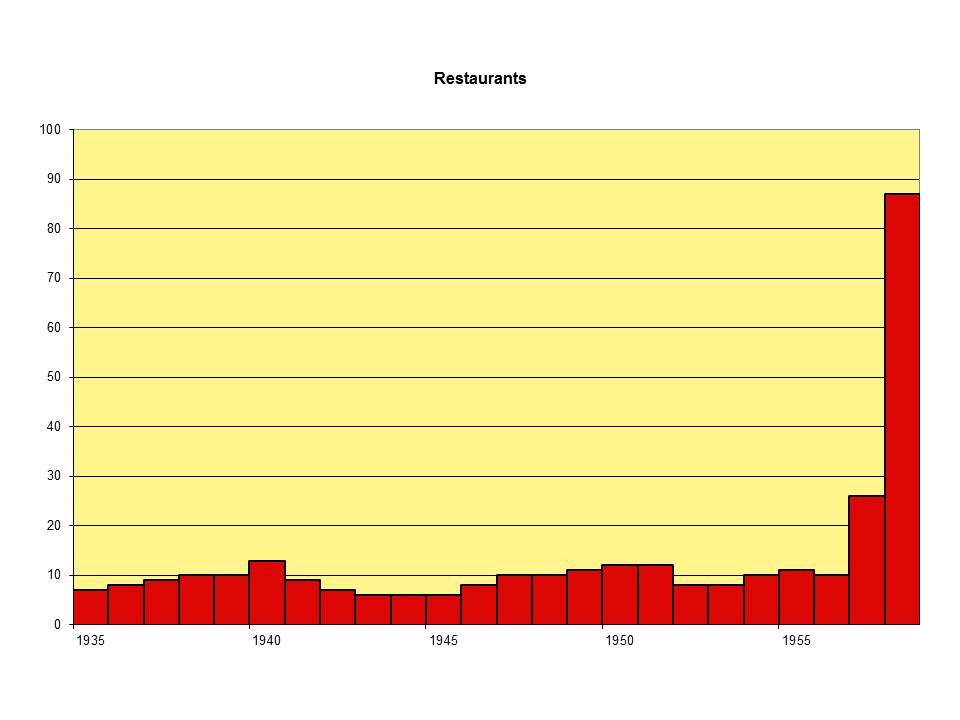
We have added even more since 2010.
The first reaction might well be, isn’t that wonderful — all these places to eat! Yes, but for most of the 80+ restaurants we have added since the 1950s means that some other business had to close, businesses that had some value to the residential neighbourhood that Grandview is outside the Drive. Where now do we buy furniture, or appliances, get our shoes repaired, etc etc?
